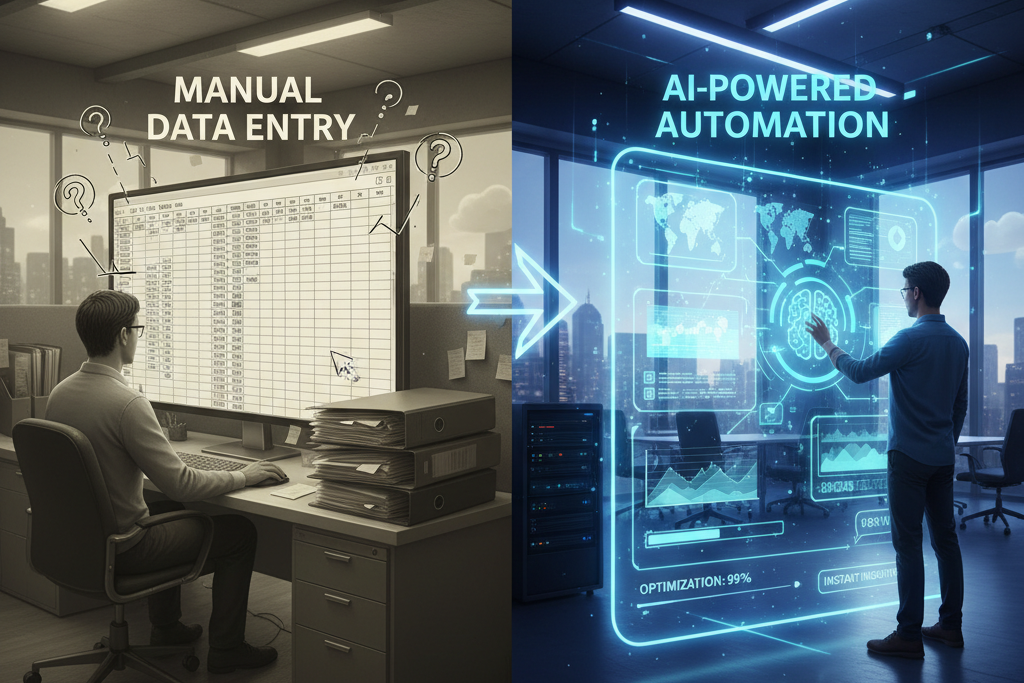
From Excel to AI – Automated Reports and Dashboards Instead of Tedious Data Entry

The Era of Tedious Reporting is Coming to an End
For decades, businesses have relied heavily on manual data processing, predominantly within spreadsheets like Microsoft Excel, to generate reports and dashboards. This approach, while familiar, has become increasingly inefficient and prone to errors in today's fast-paced digital economy. The era of tedious reporting, characterized by long hours of data extraction, manipulation, and validation, is demonstrably drawing to a close as advanced automation and Artificial Intelligence (AI) solutions emerge.
Consider the significant time expenditure associated with manual reporting. Studies frequently indicate that employees spend an alarmingly high percentage of their workweek on repetitive, data-related tasks. This often translates to hundreds of hours per year for a single employee, diverting valuable resources from strategic initiatives. The financial implications are substantial; a 2022 survey by Forbes Advisor found that 46% of small businesses still use spreadsheets for accounting, and while precise time-wasted statistics vary, the consensus among industry analysts is that manual data handling severely impacts productivity.
Beyond time, the cost of human errors in manual reporting is a critical concern. Typos, formula mistakes, or incorrect data entry can propagate through entire datasets, leading to flawed reports, misguided business decisions, and potentially severe financial losses. Rectifying these errors often requires extensive backtracking, further consuming time and resources. The introduction of AI and sophisticated automation platforms represents a fundamental shift. These technologies are engineered to assume the burden of repetitive data tasks, ensuring accuracy, consistency, and unparalleled speed. The transformation from manual Excel-based processes to intelligent, automated reporting systems is not merely an upgrade; it is a strategic imperative for organizations aiming to optimize operations, enhance decision-making capabilities, and maintain a competitive edge in a data-driven landscape.
This article explores the inherent limitations of traditional reporting, outlines how AI is revolutionizing data processing, provides a practical guide to implementing automation, and showcases real-world examples of successful transitions. The objective is to illustrate how businesses can move beyond the constraints of manual data entry towards a future where intelligent systems deliver precise, real-time insights, allowing human talent to focus on analysis and strategic growth rather than data mechanics.

Why Excel is No Longer Enough? 5 Biggest Problems of Traditional Reporting
While Microsoft Excel remains a powerful and ubiquitous tool for many business functions, its inherent limitations become glaringly apparent when scaling reporting processes to meet the demands of modern enterprises. For complex, dynamic data environments, traditional Excel-based reporting creates bottlenecks, introduces risks, and ultimately hinders strategic progress. Understanding these challenges is crucial for recognizing the necessity of advanced automation.
Problem 1: Time-Consuming Manual Data Entry
One of the most significant drawbacks of traditional reporting is the pervasive reliance on manual data entry and manipulation. Employees spend countless hours exporting data from various sources—CRM systems, ERPs, marketing platforms, financial tools—then meticulously copying, pasting, cleaning, and aggregating this information into spreadsheets. This process is not only monotonous but also a massive drain on productivity, diverting skilled personnel from higher-value activities like analysis and strategy development.
Problem 2: Human Errors and Their Consequences
Manual data handling is inherently susceptible to human error. A single typo, an incorrect formula, or an overlooked data point can corrupt an entire report, leading to inaccurate insights and flawed decision-making. The consequences can range from minor operational inefficiencies to significant financial losses, misallocation of resources, or missed market opportunities. Detecting and correcting these errors is often a time-intensive forensic exercise, further eroding efficiency.
Manual data handling is inherently susceptible to human error; a single typo or incorrect formula can corrupt an entire report, leading to inaccurate insights and flawed decision-making.
Problem 3: Lack of Time for Strategic Analysis
When the majority of time is consumed by the mechanics of report generation, little bandwidth remains for actual data analysis. Managers and analysts find themselves in a constant cycle of data preparation rather than interpreting trends, identifying opportunities, or developing actionable strategies. This operational focus prevents proactive decision-making and limits an organization's ability to leverage its data for competitive advantage.
Problem 4: Scalability Limitations
As businesses grow, so does the volume and complexity of their data. Excel spreadsheets, while capable for smaller datasets, quickly become unwieldy and slow when dealing with large volumes of information. Merging data from numerous sources, managing complex interdependencies between sheets, and updating reports frequently becomes a monumental task that is difficult to scale effectively. This can lead to delays in report delivery and an inability to adapt to changing business requirements.
Problem 5: Lack of Integration with Modern Systems
Modern businesses operate with a diverse ecosystem of software applications, from CRM and ERP to marketing automation and financial management systems. Excel often acts as a silo, requiring manual export and import, which breaks the flow of data across the organization. This lack of seamless integration prevents real-time data synchronization, leading to outdated reports and a fragmented view of business performance. It also complicates efforts to create holistic dashboards that pull from all relevant data points automatically.
AI Revolution in Reporting: How Automation is Changing the Game
The advent of Artificial Intelligence and advanced automation has fundamentally reshaped the landscape of business reporting, transforming it from a laborious, backward-looking activity into a dynamic, forward-thinking strategic asset. AI-driven solutions are not just improving existing processes; they are enabling entirely new capabilities that were previously unimaginable with traditional methods. This revolution centers on precision, speed, and intelligence, effectively changing the game for data-driven organizations.
Time Savings Through Automation
One of the most immediate and impactful benefits of AI in reporting is the dramatic reduction in time spent on data tasks. AI and automation platforms can connect directly to various data sources, extract relevant information, clean it, transform it, and generate comprehensive reports and dashboards without human intervention. This process, which might take hours or days manually, can be completed in minutes or even seconds. The time saved is then reallocated to analytical and strategic tasks, where human expertise provides greater value.
AI-driven automation fundamentally reshapes reporting, enabling greater efficiency, accuracy, and faster decision-making by eliminating human errors and accelerating data analysis.
Elimination of Human Errors
AI systems are designed to process data with unwavering accuracy, largely eliminating the human errors endemic to manual data entry and manipulation. Algorithms perform calculations consistently, apply predefined rules precisely, and identify anomalies that a human might miss. This leads to a higher degree of data integrity, ensuring that reports are based on reliable information and fostering greater confidence in the insights derived.
Faster Decision Making
With automated reporting, businesses gain access to real-time or near real-time data. Intelligent dashboards update automatically, presenting the latest metrics and trends as they unfold. This immediate access to accurate information empowers leaders to make faster, more informed decisions, react quickly to market changes, and seize emerging opportunities, moving from reactive problem-solving to proactive strategic planning.
Proactive Data Analysis
Beyond simply automating report generation, AI can perform sophisticated data analysis, identifying patterns, correlations, and predictive insights. Machine learning algorithms can forecast future trends, highlight potential risks, and recommend optimal actions. This proactive analysis capability allows businesses to anticipate challenges before they materialize and leverage opportunities for growth, rather than merely reacting to historical data.
Examples of Companies That Underwent Transformation
Across various industries, companies are experiencing profound transformations. For instance, large retail chains are using AI to automate sales forecasting and inventory management, significantly reducing stockouts and overstock. Financial institutions are leveraging AI for fraud detection and regulatory compliance reporting, streamlining complex processes and enhancing security. Manufacturing firms are employing AI for predictive maintenance, automating data collection from sensors to prevent equipment failures and optimize production schedules. These examples underscore a universal truth: AI-driven reporting is not a niche solution but a universal accelerator for operational excellence and strategic advantage.

What Does the Transformation Process from Excel to AI Look Like? Practical Guide
Transitioning from traditional, Excel-based reporting to an AI-powered automated system is a strategic initiative that requires careful planning and execution. It's not merely about swapping one tool for another; it's a comprehensive transformation of how an organization perceives, processes, and utilizes its data. A structured, step-by-step approach ensures a smooth migration and maximizes the benefits of automation.
Step 1: Audit of Current Reporting Processes
The initial phase involves a thorough audit of all existing reporting processes. This includes identifying every report currently generated, the data sources for each, the manual steps involved (e.g., data extraction, cleaning, aggregation), the frequency of reports, and their recipients. Documenting the pain points—such as time spent, error rates, and data inconsistencies—is crucial. This audit provides a baseline for measuring future improvements and clarifies which reports are critical for automation.
Step 2: Identification of Key Indicators
Following the audit, the focus shifts to defining Key Performance Indicators (KPIs) and critical metrics. Not all data points are equally important. Organizations must identify the core indicators that genuinely drive business decisions and reflect strategic objectives. This involves working closely with stakeholders from various departments to ensure alignment on what constitutes essential information. Clearly defined KPIs will guide the design of automated dashboards and reports, ensuring they provide actionable insights rather than just raw data.
Step 3: Selection of Appropriate Tools
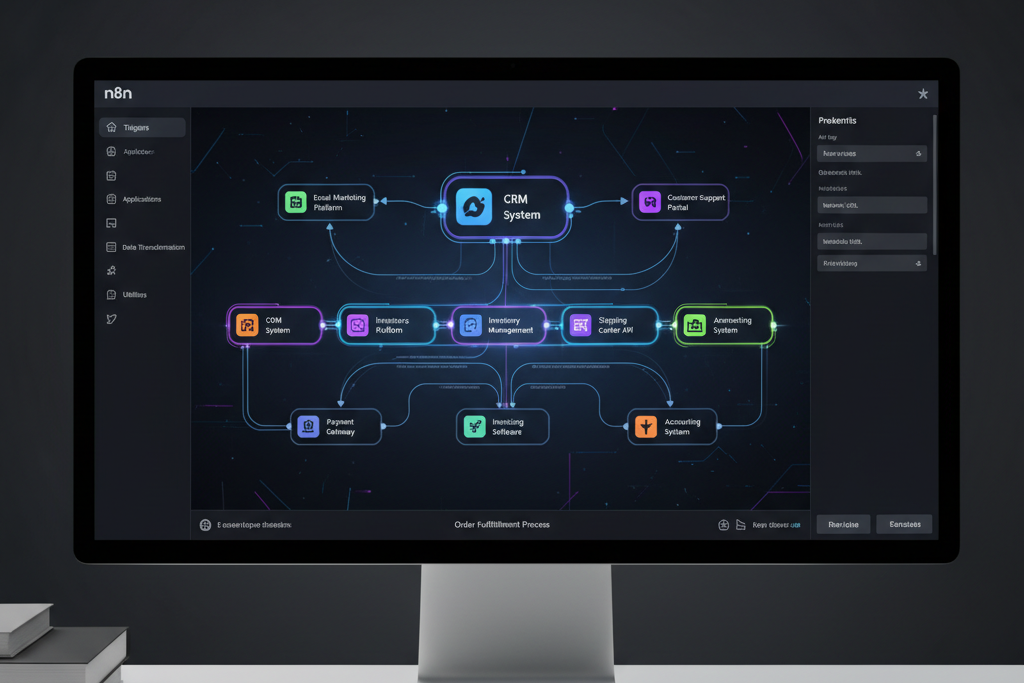
With a clear understanding of current processes and required KPIs, the next step is to select the right automation and AI tools. This choice depends on factors such as data complexity, existing IT infrastructure, budget, and specific business needs. Options range from low-code/no-code platforms like n8n for workflow automation, specialized Business Intelligence (BI) tools, to custom AI solutions for predictive analytics. It is vital to choose tools that offer robust integration capabilities and scalability.
Step 4: Integration with Existing Systems
Seamless integration is paramount for effective reporting automation. The chosen tools must be able to connect directly and securely with all relevant data sources—CRMs, ERPs, marketing platforms, financial systems, databases, and more. This eliminates manual data exports and imports, ensuring that the automated system receives accurate, real-time data. APIs (Application Programming Interfaces) play a critical role here, facilitating automated data flow and synchronization across the entire technological ecosystem.
Step 5: Team Training
Technology alone is insufficient; human adoption is key. Comprehensive training for the teams that will use and manage the new automated reporting system is essential. This includes training for analysts on how to interpret new dashboards, for managers on how to leverage insights for decision-making, and for IT personnel on system maintenance and troubleshooting. Fostering a culture of data literacy and encouraging buy-in from all levels of the organization ensures that the investment in automation yields its full potential.
Lumi Zone Case Study: Real Examples of Reporting Automation
Lumi Zone specializes in developing tailored AI automation solutions that eliminate manual tasks and streamline operations for businesses. Our approach focuses on delivering simple, effective, and stable systems designed to meet specific client needs without relying on templates or hidden complexities. Here are several real-world examples from Lumi Zone's portfolio demonstrating how reporting automation transforms business processes and delivers tangible benefits.
Example 1: Sales Reports Automation
A B2B client struggled with generating weekly sales performance reports. Data from their CRM (Salesforce) and invoicing system (QuickBooks) had to be manually extracted, reconciled, and formatted in Excel, a process taking 8-10 hours per week. Lumi Zone implemented an n8n automation workflow that connects directly to both systems. It automatically pulls sales figures, customer acquisition data, and revenue metrics, then processes and aggregates them into a standardized Google Sheet and a dynamic dashboard in a BI tool. This solution reduced reporting time to virtually zero, freeing the sales operations team to focus on strategic analysis of sales trends and pipeline optimization.
Example 2: Analytical Dashboards for E-commerce
An e-commerce retailer faced challenges in gaining real-time insights into their sales, marketing, and inventory performance. Their data was scattered across Shopify, Google Analytics, Meta Ads, and their warehouse management system. Lumi Zone developed a bespoke analytical dashboard using Bolt.new, integrated with n8n to centralize and visualize all key metrics. This automated system provides real-time updates on conversion rates, average order value, customer acquisition costs, and inventory levels. The client can now instantly identify top-performing products, optimize ad spend, and manage stock more efficiently, leading to a significant uplift in overall operational agility.
Example 3: Integration with CRM Systems
For a service-based business, ensuring their CRM system (HubSpot) was always updated with accurate client interaction data from various communication channels (email, phone calls, support tickets) was a manual and error-prone task. Lumi Zone implemented an AI-powered integration solution. AI agents analyze incoming communications, extract key details, and automatically update client records within HubSpot, including interaction summaries, sentiment analysis, and next-step recommendations. This not only keeps the CRM consistently accurate but also provides sales and support teams with a comprehensive, real-time view of each customer, enhancing personalization and service quality.
Example 4: Automatic Alerts and Notifications
A logistics company needed immediate alerts for critical operational deviations, such as shipment delays, inventory discrepancies, or performance drops in their fleet. Their existing system required manual monitoring. Lumi Zone developed an automated alert system integrated with their logistics management software. Using n8n, the system continuously monitors predefined thresholds and triggers instant notifications (via email, Slack, or SMS) to relevant personnel when an anomaly occurs. For instance, if a shipment is delayed beyond a certain timeframe, the system automatically alerts the logistics manager and updates the client communication portal. This proactive approach significantly reduces response times and mitigates potential service disruptions.
Automation Tools: n8n, Bolt.new and AI Agents in Action
Lumi Zone's expertise lies in leveraging a curated suite of powerful, flexible, and robust automation technologies to build intelligent systems tailored to specific client needs. Our independence from specific vendors allows us to select the best tools for each unique challenge, with n8n, Bolt.new, and AI agents being central to our solution architecture. These tools, when combined, create seamless, highly integrated, and efficient operational workflows.
n8n: Business Workflow Automation
n8n is an open-source, low-code workflow automation platform that serves as the backbone for many of Lumi Zone's integration projects. It allows for the creation of complex automated workflows by connecting hundreds of different applications and services. With n8n, businesses can automate virtually any repetitive task, from data synchronization between CRMs and accounting software to triggering email sequences based on website activity, or generating reports from disparate data sources. Its visual workflow builder makes it accessible for non-developers while offering powerful customization for advanced users. Lumi Zone utilizes n8n for its flexibility, extensive integration capabilities, and ability to handle intricate data transformations, ensuring that data flows precisely where it needs to go, when it needs to go there.
Bolt.new: Web Application Creation
Bolt.new is a versatile low-code platform for rapidly building custom web applications. It empowers Lumi Zone to create bespoke internal tools, client portals, and dynamic dashboards that are perfectly aligned with a client's operational requirements. Unlike off-the-shelf software, applications built with Bolt.new are entirely customized, offering only the necessary features and a user experience optimized for specific workflows. This platform is ideal for developing interactive reporting dashboards, custom CRM interfaces, or specialized operational management systems that integrate seamlessly with other automated workflows, providing a centralized hub for data visualization and interaction.
AI Agents: Customer Service Automation
AI agents represent a crucial component in enhancing customer interaction and data collection. These intelligent agents, often powered by advanced natural language processing (NLP), can automate customer service tasks, handle inquiries via chat or phone, and even perform sentiment analysis. For reporting, AI agents can extract structured data from unstructured conversations, identify common issues, and summarize customer feedback, feeding this information directly into analytical dashboards. Lumi Zone deploys AI agents to streamline customer support, enrich CRM data with qualitative insights, and provide automated, personalized communication, ultimately freeing human staff for more complex problem-solving.
Integrations Between Systems
The true power of Lumi Zone's solutions lies in the intelligent integration between these tools and existing client systems. Using n8n, we build bridges between CRMs, ERPs, marketing automation platforms, accounting software, and custom applications built with Bolt.new. This interconnected ecosystem ensures that data is always consistent, up-to-date, and accessible across the organization. For example, an AI agent might capture lead information, which n8n then automatically pushes to the CRM, triggers a marketing automation sequence, and updates a Bolt.new-powered sales dashboard—all without any manual intervention. This holistic approach to integration eliminates data silos and creates a unified, automated operational environment.
Measuring Results: How to Calculate ROI from Reporting Automation
Implementing reporting automation is a strategic investment, and like any investment, its success should be measured through a clear understanding of its Return on Investment (ROI). Quantifying the benefits of automation moves it from a mere technological upgrade to a proven driver of business value. Measuring ROI involves assessing both direct and indirect gains, providing concrete evidence of the transformation's positive impact.
Time Savings Calculation
The most straightforward metric to calculate is time savings. Begin by identifying the average time spent on manual reporting tasks before automation (e.g., hours per report * frequency). Then, measure the time required after automation (often negligible for automated reports). Multiply the saved hours by the average hourly cost of the personnel involved. This direct saving in labor hours is a primary component of ROI. For instance, if a report took 10 hours weekly at $50/hour, automating it saves $500/week or $26,000 annually per report.
Data Accuracy Improvement
While harder to quantify precisely in monetary terms, improved data accuracy has significant indirect financial benefits. Before automation, track the number and impact of errors found in reports (e.g., incorrect invoices, misallocated resources due to bad data, delayed decisions). After automation, monitor the reduction in these error incidents. Less time spent on error correction, fewer financial discrepancies, and more reliable decision-making all contribute to a positive ROI, even if not directly reflected in a simple calculation.
Faster Decision Making
Accelerated access to real-time data enables quicker, more informed decisions. To measure this, compare the average time it took to generate a critical report and make a decision before and after automation. Identify specific instances where faster data availability led to a quicker response to market changes, a successful new initiative launch, or avoiding a potential pitfall. While often qualitative, the strategic advantage gained from speed can be linked to revenue growth or cost avoidance.
Team Productivity Increase
Beyond direct time savings on reporting, automation frees up valuable employee time to focus on higher-value, strategic tasks. Assess if teams are now engaging more in analysis, innovation, or client engagement. This can be measured by tracking performance metrics related to these strategic activities. For example, if sales teams spend less time compiling reports and more time selling, an increase in sales figures can be partially attributed to the automation. This boosts overall organizational productivity and employee morale.
Sample Calculations
Consider a department spending 20 hours per week on manual data aggregation and report generation, with an average labor cost of $40 per hour.
Before Automation: 20 hours/week * $40/hour = $800/week = $41,600/year in labor costs for reporting.
After Automation: Time reduced to 2 hours/week (for oversight/minor adjustments) * $40/hour = $80/week = $4,160/year.
Annual Savings: $41,600 - $4,160 = $37,440.
If the initial investment in automation software and implementation was $15,000, the ROI in the first year alone is ($37,440 - $15,000) / $15,000 * 100% = 149.6%. This does not even account for improved accuracy or faster decision-making.